4.1 Understanding the Console
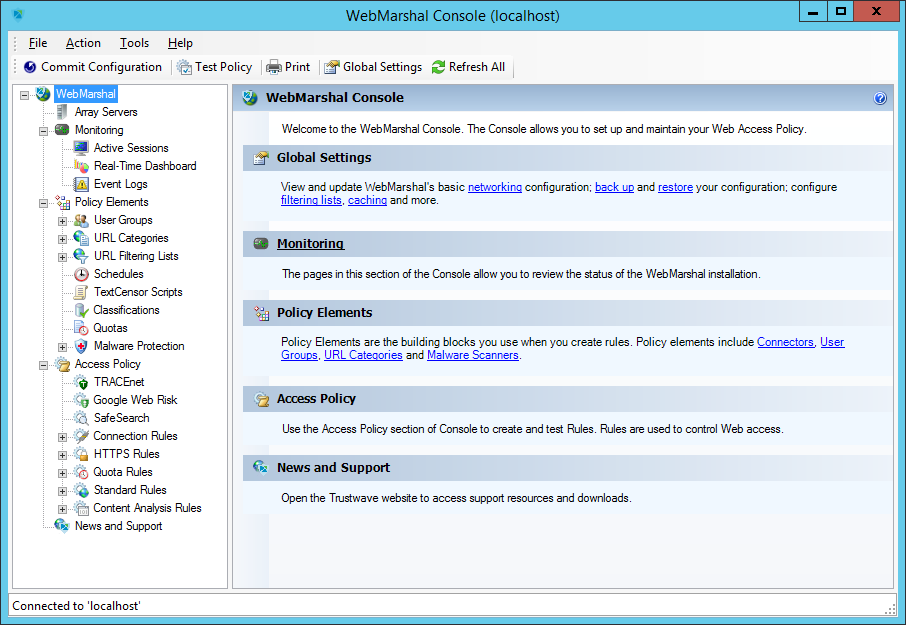
The WebMarshal Console is the main interface for configuration of WebMarshal behavior. This section describes the features and elements available in the Console. Many of these elements are covered in more detail in the following chapters of this Guide.
Figure 16: WebMarshal Console

The Console features an icon tool bar, a menu bar, and two main panes. The right pane displays detailed information using “taskpad” web pages with links to common tasks and submenus. The left pane provides a menu tree that allows access to the main elements. Important notices display in the Status Bar at the bottom of the window.
•To expand a branch of the menu tree, click the associated + symbol. The items contained within this branch are displayed.
•To select an item in either pane, click it to highlight it.
•To display detailed information about an item, select it in the left pane. Detailed information displays in the right pane.
•To collapse an expanded menu element click the associated - symbol.
•To work with an item in either pane, right-click to view a menu of available options. The main Console and each taskpad also provide toolbar links to common tasks.
•To sort the information in a list view, click a column title.
•To customize the columns in any right pane list view:
a.Right-click a detail item and select Select Columns to open an Add/Remove Columns window.
b.To add or remove a column from the list, select it and click Add or Remove.
c.To change the display order, select an item in the Displayed Columns list and click Move Up or Move Down.
WebMarshal retains custom column views for each user on each computer where the Console is installed.
|
Note: In most cases, you can access items in the Console by multiple methods including toolbar buttons or icons, right-click context menus, and keyboard shortcuts. This Guide normally refers to the buttons. |
4.1.2 Working With Properties Configuration
You can set many global properties of WebMarshal using three properties windows.
On this window you can control basic properties of a WebMarshal installation. To open this window, select Tools > Global Settings from the toolbar.
Each WebMarshal installation includes one or more processing servers. To see a list of these servers, select Array Servers in the left pane. The right pane will show a list of installed servers. To configure settings for a server, click to select that server in the right pane, then click the Properties icon in the taskpad toolbar.
You can group WebMarshal servers to apply customized configuration and rules for different locations in your network. To configure settings for a group, expand Array Servers in the left pane, right-click the group, and then select Properties from the context menu.
For more information about the properties and settings shown on these three windows, see “Configuring Global Settings”, “Managing Array Servers”, and “Configuring Server Group Properties”.
When you select this item, the right pane displays a list of all processing servers in the WebMarshal array. The list shows the status of each server. If the rule and configuration changes made in the console have not yet been reloaded into the servers, the Commit Configuration icon displays in red, and an asterisk is added to the caption WebMarshal (at the top of the left pane).
If you have configured server groups, the list shows the servers in their groups. To work with a group, expand the Array Servers item and select the group.
For more information on working with servers, see “Configuring Global Settings”.
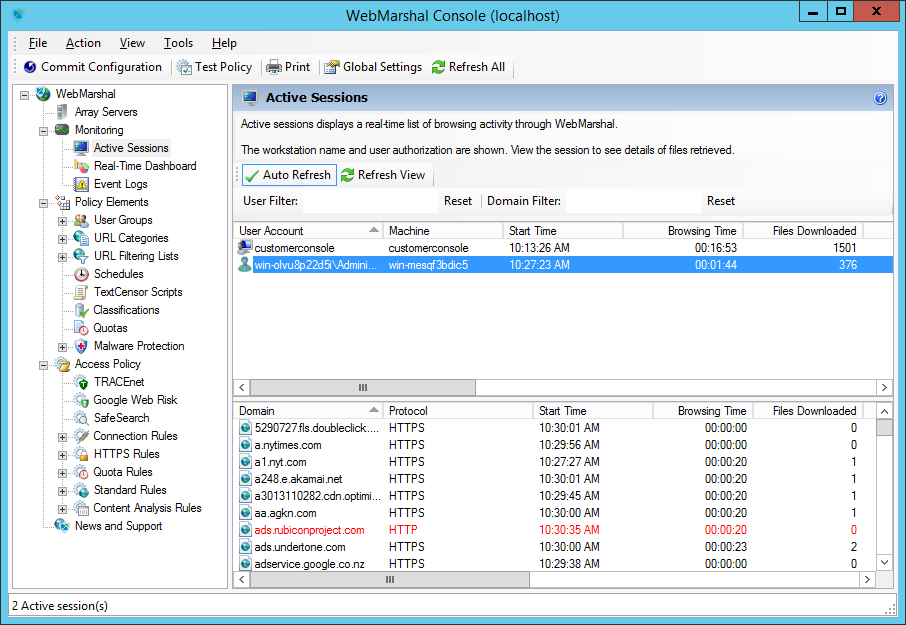
When you select this item (Monitoring > Active Sessions), the right pane shows a list of current browsing sessions through WebMarshal by user account and machine. You can drill down to view details. You can right-click items for more options. For detailed information see Help.
|
Note: A WebMarshal session ends when no new pages have been requested for a defined period (by default, 5 minutes). You can adjust this session time-out value. For more information, see “Viewing Product Information”. |
Figure 17: WebMarshal Console, Active Sessions window
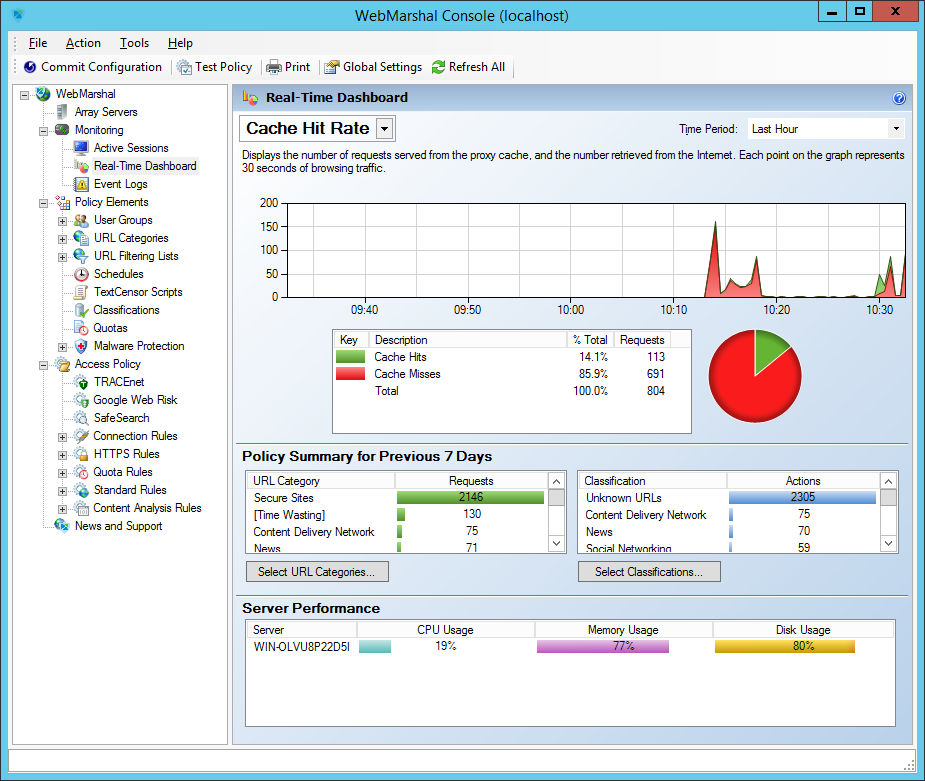
When you select this item (Monitoring > Real-Time Dashboard), the right pane shows a graphical dashboard that allows you to monitor server performance, browsing traffic, Proxy Cache statistics, TRACEnet statistics and update status, and WebMarshal action statistics. For details of the available information see Help.
Figure 18: WebMarshal Console Dashboard
When you select this item (Monitoring > Event Logs), the right pane shows a filtered view of the Windows event logs. Several filters are provided to allow easy monitoring of WebMarshal and related items on all servers in the Array. For more information, see “Viewing Windows Event Logs”.
WebMarshal Policy Elements are the basic building blocks that you can use to construct Web access Rules. Before you enable Rules, you must create or modify these Elements to fit organizational requirements.
This item shows a list of user groups configured in WebMarshal. You can import and automatically update groups through WebMarshal connectors. You can also create groups of IP addresses, and internal user groups for use only within WebMarshal. For more information on working with user groups, see “User Management”.
This item is always present in the user groups, and shows a list of all users currently available in WebMarshal. Double click any user name to see more information, including a list of the Rules that apply to the user.
This item shows a list of URL categories. URL categories are lists of URLs with similar content, for use in building rules. You can create categories locally, or you can retrieve and populate them from an externally maintained Filtering List. A few examples of URL categories are: search engines, objectionable sites, partner companies. For more information on working with URL categories, see “Understanding URL Categories”.
|
Note: Expand a category and double-click any URL to see a report of the WebMarshal Rule action, if any, that placed it in that category. (This information is not available if the URL was added manually.) |
This item shows a list of the URL Filtering List applications configured in WebMarshal. For more information about Filtering Lists, see “Configuring URL Filtering Lists”.
This item shows a list of available schedules. Schedules allow you to apply rules based on the time of day and day of the week. For more information on working with schedules, see “Configuring Access Using Schedules”.
This item shows a list of available WebMarshal TextCensor scripts. The scripts allow you to scan web pages and text files for particular key words or combinations of words. You can use TextCensor scripts to block Web requests, and also to classify visited sites into URL categories and create your own site filtering lists. Examples of TextCensor scripts are: objectionable language, sports-related terms, and active scripting keywords. For more information on working with TextCensor scripts, see “Identifying Web Content Using TextCensor Scripts”.
This item shows a list of available logging classifications. Classifications allow you to create detailed logs of rule actions. For more information about Classifications, see “Logging Activity with Classifications”.
This item shows a list of available quotas. Quotas allow you to limit a user’s browsing activity by total time and/or volume. For more information on working with quotas, see “Configuring Access Using Quotas”.
Expand this menu branch and select “Virus Scanners” to see a list of third-party virus scanners that have been configured for use in scanning file downloads and uploads. For more information on configuring malware protection, see “Using Malware Scanning”. To implement malware scanning, see Chapter 6, “Understanding Web Access Policy, Rule Containers, and Rules.”
Expand this menu branch to see its subcategories:
•TRACEnet
•Safe Search
•Connection Rules
•HTTPS Rules
•Quota Rules
•Standard Rules
•Content Analysis Rules
Select one of these subcategories to configure the rules or options available. For more information on working with access policy and rules, see Chapter 6, “Understanding Web Access Policy, Rule Containers, and Rules.”
4.1.9 Printing Configuration and Rules
You can view and print WebMarshal configuration, rules and policy elements in a convenient summary format.
To print configuration:
1.Click the Print icon in the tool bar to open the Print Options window. By default the entire configuration is selected.
2.Select the items to print.
3.Choose whether or not to include members of imported user groups (this can result in a large listing).
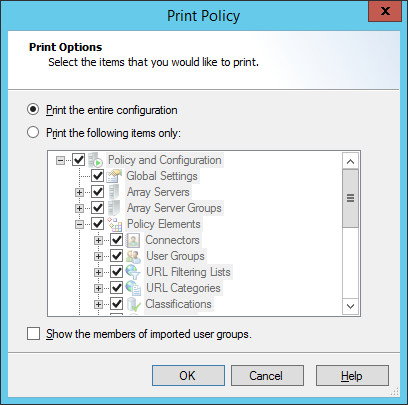
4.Click OK to view the information in a new window.
5.Click the Print icon in the new window to print the information.
|
Tip: To print an individual item from the configuration, right-click the item in either pane of the main WebMarshal Console, and then select Print Selected Item. |
The News And Support item in the console tree presents the support section of the Trustwave website in the right pane. This area features the latest support information, including frequently asked questions, a knowledge base, and a discussion forum. To access the full range of resources, customers should log in to the site. Obtain login details, if necessary, by contacting Trustwave.