
LevelBlue Completes Acquisition of Cybereason.  Learn More

LevelBlue Completes Acquisition of Cybereason.  Learn More

Services
Cyber Advisory
Managed Cloud Security
Data Security
Managed Detection & Response
Email Security
Managed Network Infrastructure Security
Exposure Management
Security Operations Platforms
Incident Readiness & Response
SpiderLabs Threat Intelligence
Solutions
BY TOPIC
Offensive Security
Solutions to maximize your security ROI
Operational Technology
End-to-end OT security
Microsoft Security
Unlock the full power of Microsoft Security
Securing the IoT Landscape
Test, monitor and secure network objects
Why LevelBlue
About Us
Awards and Accolades
LevelBlue SpiderLabs
LevelBlue Security Operations Platforms
Security Colony
Partners
Microsoft Security
Unlock the full power of Microsoft Security
Technology Alliance Partners
Key alliances who align and support our ecosystem of security offerings
Loading...
Loading...

HOWTO: Set up a dashboard to monitor LP health in the WebGUI

Expand / Collapse


This article applies to:

  • SIEM LP

Question:

  • I want to monitor the CPU usage on my LP system
  • I want to monitor the memory usage on my LP system
  • I want to monitor the amount of events parsed in the last 24 hours
  • I want to monitor the amount of events parsed in the last 7 days

Procedure:

The Dashboard Builder has a lot of options.

One of the most often overlooked is the System Health options:


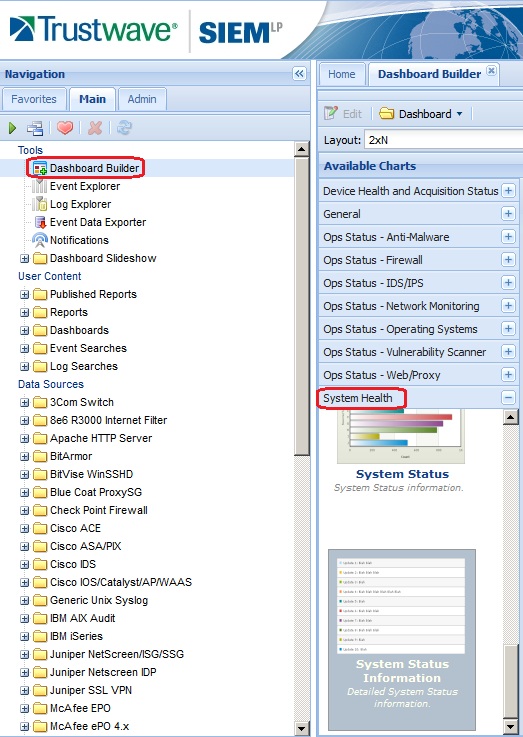
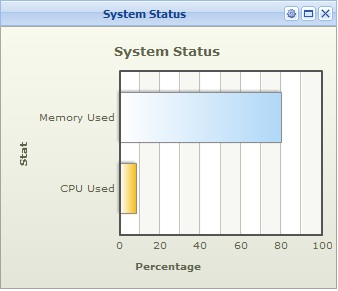
Under this set of snap-in tools for monitoring System Health are two layouts for the System Status. One of them is an easy-to-read bar graph:


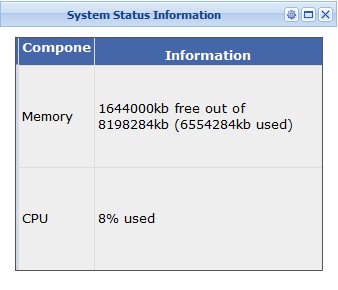
The other option is a more precise readout:

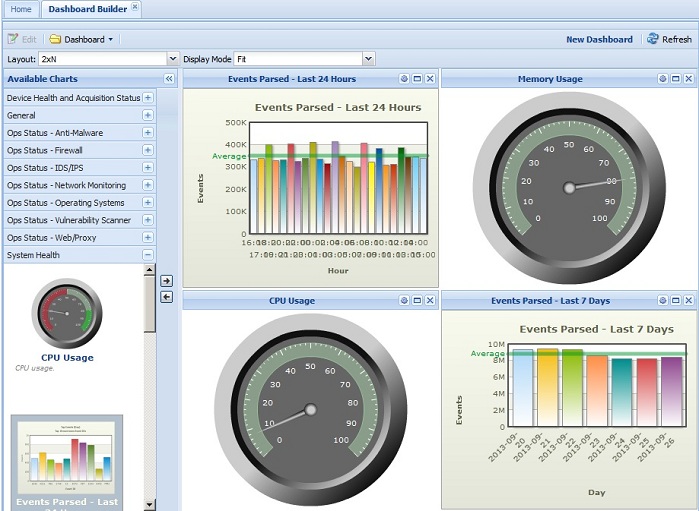
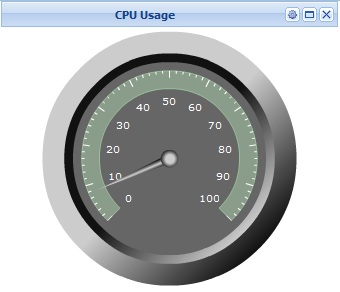
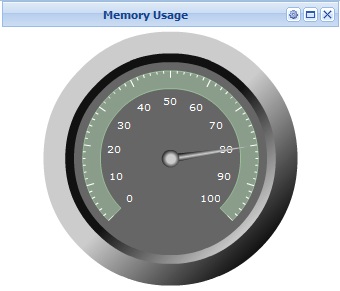
Other options for viewing the memory or CPU usage are the "speedometer" dial displays. These don't combine the output, so if you want to see both CPU and memory usage, that requires two spaces in the dashboard:


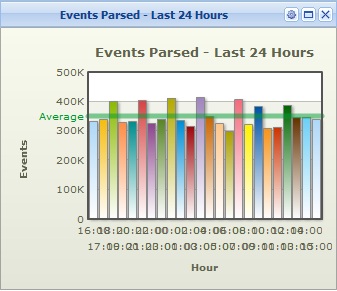
You can monitor the number of events that are parsed by your system.

  • Note: This does NOT include any logs that come into the system that are not parsed for any reason, including data that ends up in the BADPACK directories. 

You can monitor both events over 24 hours, and events over 7 days:


Here is an example of a system monitoring dashboard built on a 2x2 layout:


To contact Trustwave about this article or to request support:


Rate this Article:
     

Add Your Comments


Comment submission is disabled for anonymous users.
Please send feedback to Trustwave Technical Support or the Webmaster
.