This article applies to:
Question:
- I want to monitor the CPU usage on my LP system
- I want to monitor the memory usage on my LP system
- I want to monitor the amount of events parsed in the last 24 hours
- I want to monitor the amount of events parsed in the last 7 days
Procedure:
The Dashboard Builder has a lot of options.
One of the most often overlooked is the System Health options:
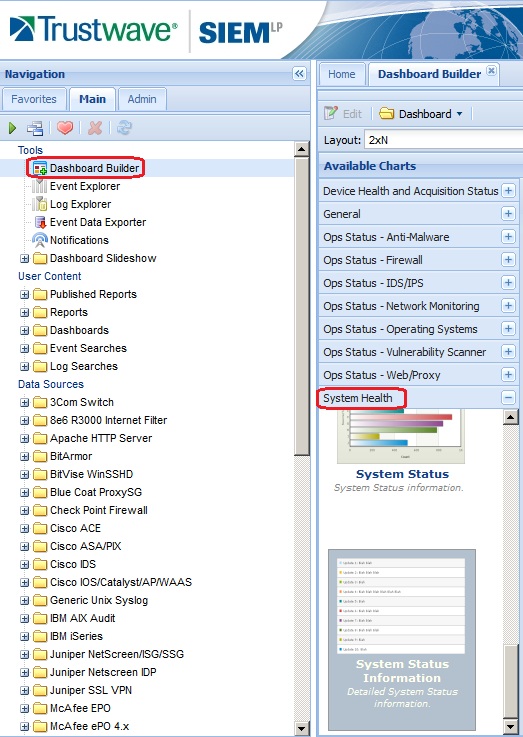
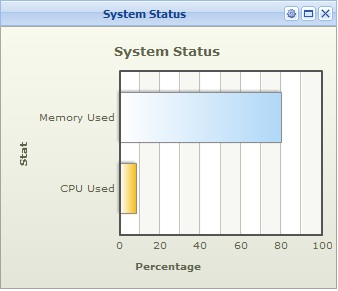
Under this set of snap-in tools for monitoring System Health are two layouts for the System Status. One of them is an easy-to-read bar graph:
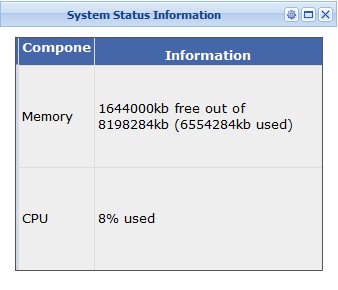
The other option is a more precise readout:
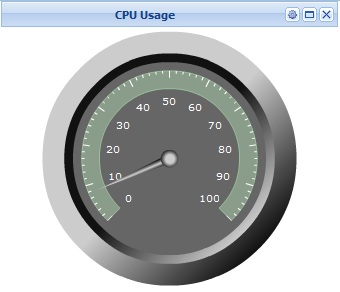
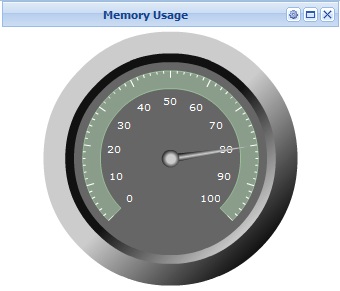
Other options for viewing the memory or CPU usage are the "speedometer" dial displays. These don't combine the output, so if you want to see both CPU and memory usage, that requires two spaces in the dashboard:
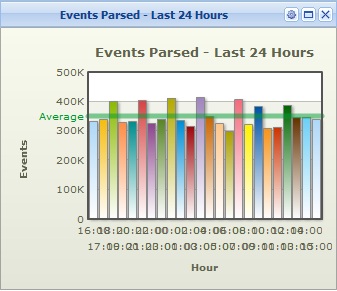
You can monitor the number of events that are parsed by your system.
- Note: This does NOT include any logs that come into the system that are not parsed for any reason, including data that ends up in the BADPACK directories.
You can monitor both events over 24 hours, and events over 7 days:

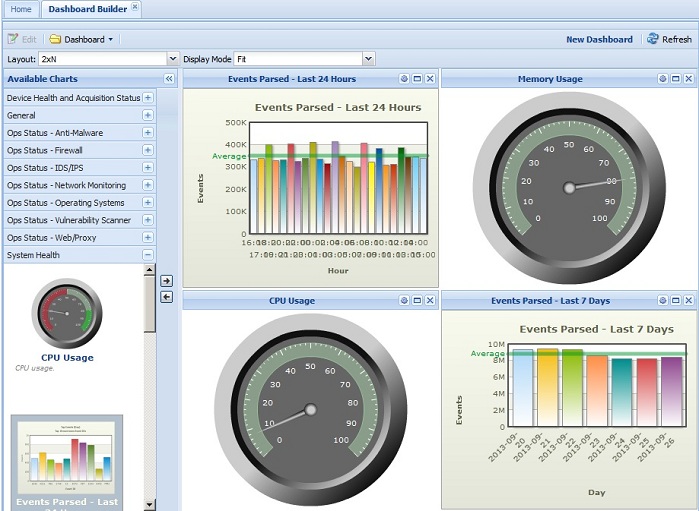
Here is an example of a system monitoring dashboard built on a 2x2 layout:
