This article applies to:
Question:
- How to analyze internet usage from the Web Filter
Procedure:
The Usage Graph window can be accessed by Logging into the Filter and going to Reporting >Usage Graph.
This window is used for viewing and analyzing Internet usage data for a specified time period within the past 14 days. The following data can be analyzed for the given time period: number of URLs accessed by end users, number of machine IP addresses accessing the Internet, and number of end users who have been authenticated (if using the authentication feature)
There are two sets of graphs that can be viewed under this option:
1. The Recent Trend graph includes date range, and Number of Hits per Hour for a given date.

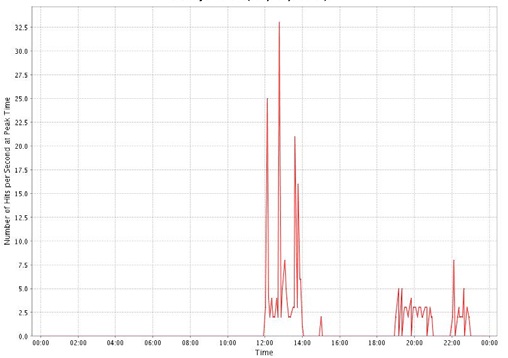
2. The Daily Peaks graph includes the date, and Number of Hits per Second at Peak Time for a given Time using the HH:MM format