This article applies to:
Question:
How do I customize the look and feel of my Firewall Suite reports?
Procedure:
It is possible to customize the look and feel of your reports by modifying the colors of backgrounds, selections and tables, as well as by changing the font styles and footer logo. You may edit an already existing style type or you can create one from scratch.
To customize the style of your Firewall Suite report:
- From the main console access the Tools menu and select Style Editor.
- Select the Create new report style radio button and click Next.
- The Color Configuration will populate. These options will allow you to change the colors of the pages and tables.
- On the same window it is possible to use a graphic image as a background for your reports by browsing to a file.
- Once you have completed making your selection click Next to arrive at the Font Selection options.
- Select the font type you would like to see in your reports and then click Next. The Table Layout options will result.
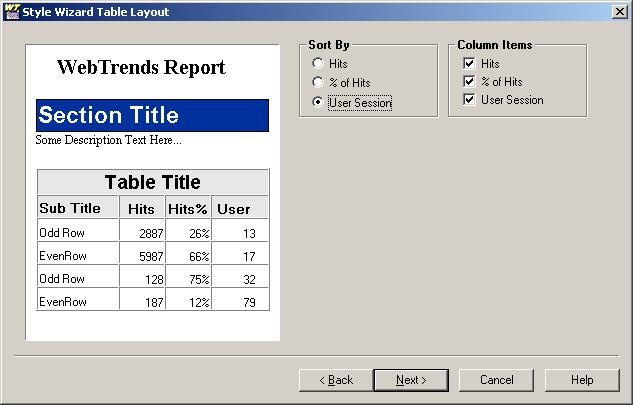
- You may select how the tables should be sorted and which items are included in the tables. Then click Next to move to the Page Layout options.
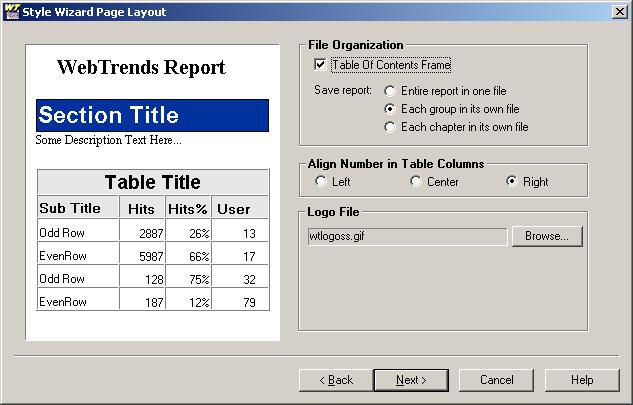
- The following options are available:
- File Organization:
Table of Contents Frame: To include a framed table of contents in HTML reports, select this option. When this option is selected, you may choose how the report file is saved.
Entire report in one file: Saves the entire report as one file.
Each group in its own file: Saves each group (for example, General Statistics, Bandwidth Usage) in a separate file.
Each chapter in its own file: Saves each chapter (for example, the General Firewall Statistics chapter in the General Statistics group) in a separate file.
- Align Number in Table Columns: Select the alignment preference. The default option is "Right".
- Logo File: It is possible to display a logo of your choice in the report. Browse to the file for the logo.
- Click Next for the Graphing Options.
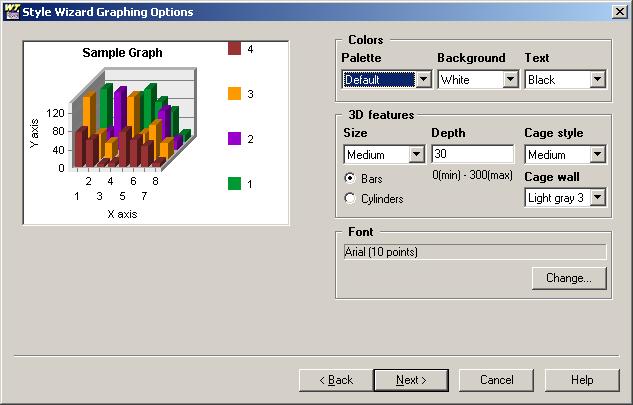
- A number of different style options are available for the graphs such as Color, 3D Features, and Font.
Once you have made your selections click Next. The Finalization dialog will populate.
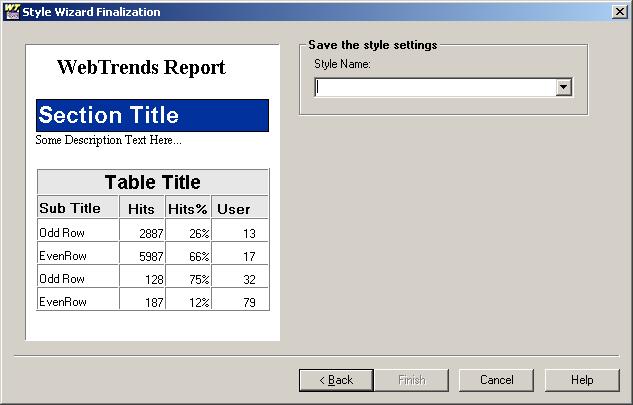
- Enter the Style Name and click the Finish button.
- The new style has now been created. For your report(s) to reflect this new style a few additional steps are required.
- If you are running an on-demand report:
Highlight the profile and click the Report option at the left of the main console. Select a template, click Edit, and select the Style tab. From the Report Style menu, choose the style you just created. Start the report.
- If you are running a report through the Scheduler: Edit the scheduled event, and click the Report button. Select a template, click Edit, and select the Style tab. From the Report Style menu, choose the style you just created. Save the event.
- This article was previously published as:
- NETIQKB936